Real-time visibility into infrastructure and application failures is essential for ensuring high availability in today’s digital environment. Traditional monitoring solutions often struggle to detect these issues effectively. Apache Pinot, a real-time distributed OLAP datastore, enhances businesses’ ability to access powerful analytical data quickly. By utilizing Pinot’s architecture, organizations can achieve near real-time visibility and perform analytics on failures within their infrastructure and applications. This capability enables uninterrupted operations and higher availability, allowing teams to identify and address issues swiftly, reduce downtime, and maintain service quality in a fast-paced digital landscape.
What is Apache Pinot?
Apache Pinot is a distributed and, most importantly, columnar real-time data storage platform. Built initially by LinkedIn and operated by the Apache Software Foundation, Pinot was conceptualized to accommodate diverse real-time data inputs while providing almost real-time responses to queries. It is most appropriate in cases where the result from large data sets is required quickly. Thus, the appropriate use case is real-time analysis and monitoring.
Key Features of Apache Pinot
Real-Time Data Intake: Pinot empowers fast data ingestion from multiple sources, namely streaming systems such as Apache Kafka and batch systems such as Hadoop.
Columnar Storage: The flexibility of storing data in columns rather than in rows helps you retrieve and analyze data more quickly.
Fast Querying: Pinot provides quick query results, making it very important for real-time analysis.
Scalability: The distributed design can facilitate horizontal expansion to accommodate more big data and queries.
The Need for Real-Time Observability
Observability is collecting, analyzing, and visualizing IT infrastructure and applications data to monitor performance, detect anomalies, and predict potential failures. With the rapid growth of cloud-native applications and distributed architectures, achieving real-time observability has become increasingly challenging due to the following reasons:
Volume, Velocity, and Variety of Data: Modern applications generate massive log and metric data in real-time, which needs to be processed and analyzed immediately.
Dynamic Environments: Containers, microservices, and application outsourcing mean that an application can adapt to growing traffic by making more or fewer instances, which hacking tools can exploit, leaving traditional monitoring tools in denial of tracking these short-lived instances.
Proactive Issue Detection: It is especially important to identify problems before they affect end-users. Real-time data analysis makes decisions quicker; actions can be taken if problems develop.
How Apache Pinot Fits into Observability and Analytics
Apache Pinot features that allow one to use it in real-time observability and analytics include:
- Real-Time Data Collection: Pinot integrates with platforms like Apache Kafka for real-time data ingestion and low-latency querying, allowing teams to monitor system health instantly.
- Scalable Architecture: Its distributed architecture supports horizontal scalability, efficiently handling petabytes of data as observability needs grow.
- Rich Query Support: Pinot offers complex OLAP queries through a SQL interface, enabling detailed application performance and failure analyses.
Implementing Real-Time Observability with Apache Pinot
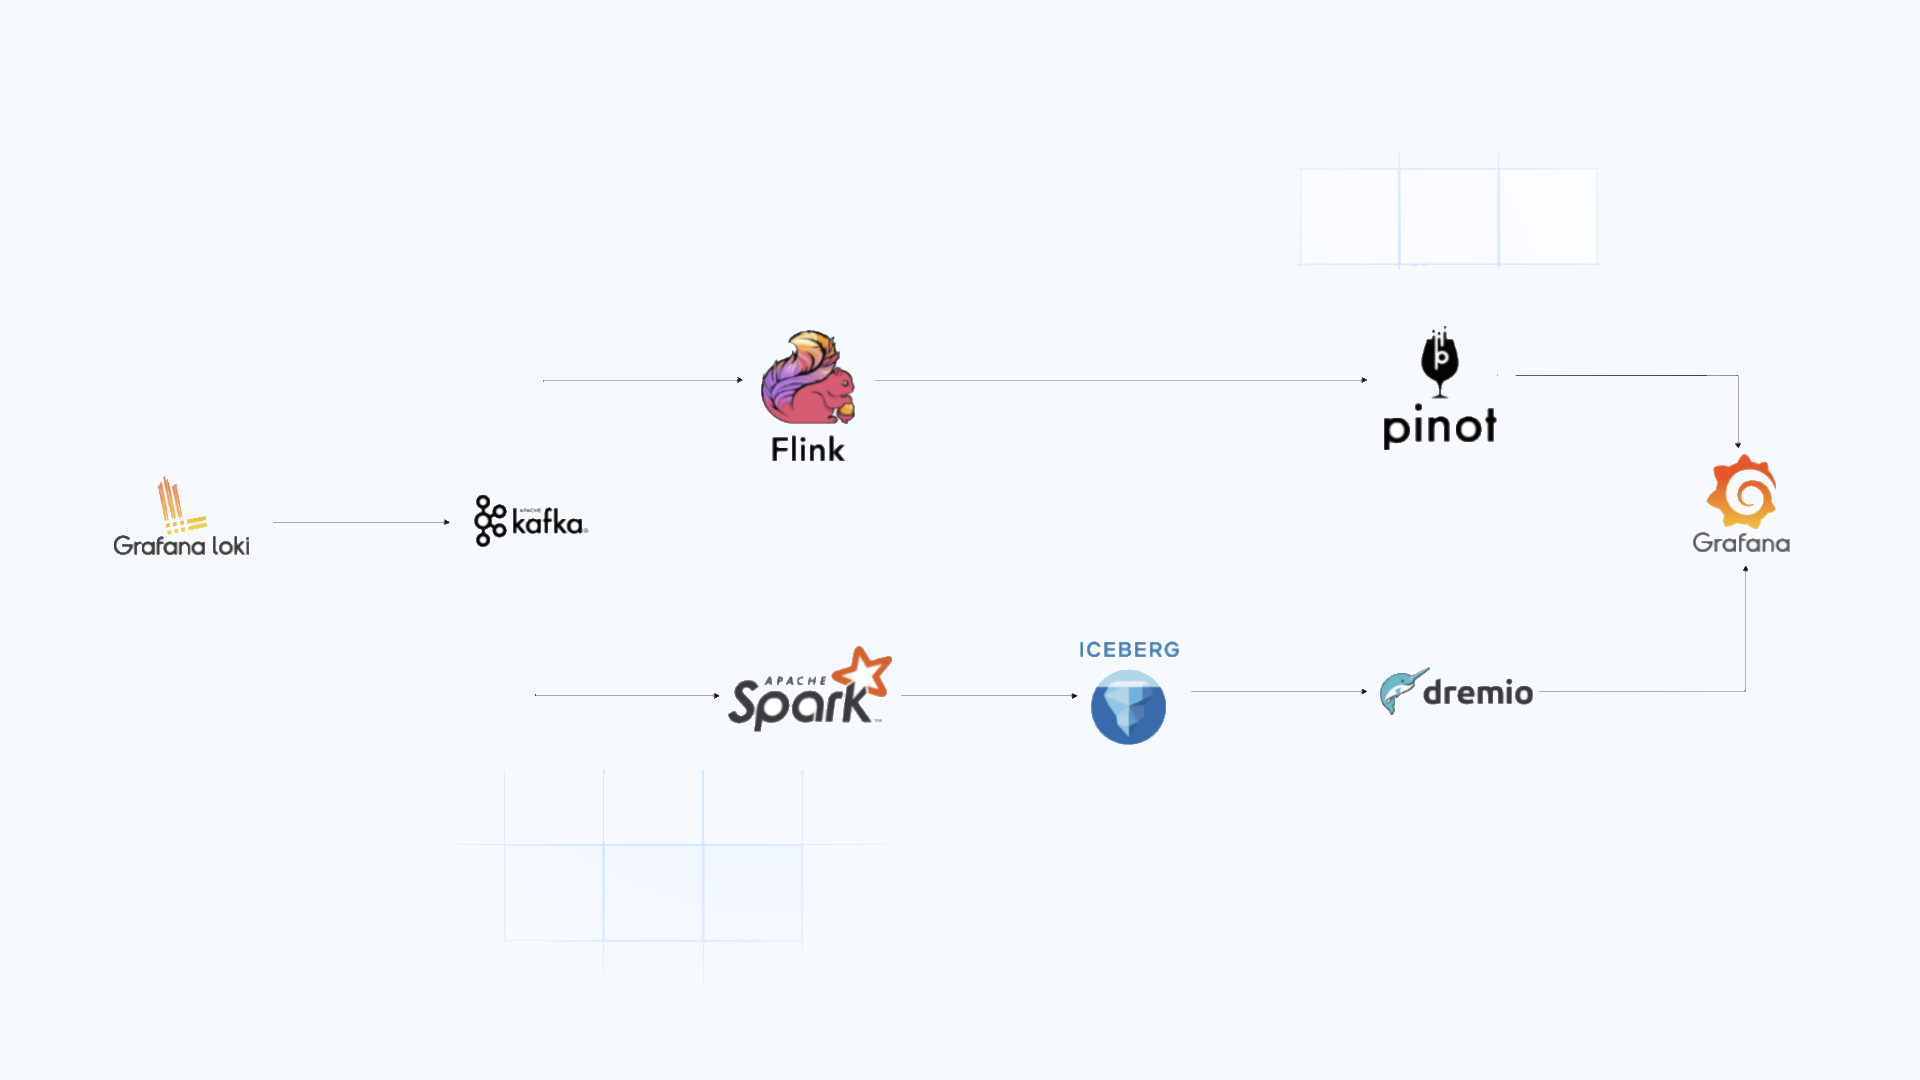
This architecture integrates Grafana Loki, Apache Kafka, Apache Flink, Apache Pinot, Apache Spark, Apache Iceberg, and Dremio for real-time observability and analytics. It enables immediate detection of critical alerts and periodic analysis of historical trends, allowing teams to monitor current operations while gaining insights from past data to improve performance.

Components
- Kafka: A high availability, highly concurrent event streaming service that empowers logs to be persistent for stream and batch analytics.
- Flink: Low latency data reprocessing is optimal for real-time log transformations in stream processing engine software.
- Pinot: Because it is intended for real-time OLAP query, Pinot optimizes and provides quick query of log data.
- Spark: Stable processing component optimal for data transformation and aggregation with large amounts of data.
- Iceberg: It enables optimal and elastic data lake storage with ACID properties.
- Dremio: It enhances the rate at which querying and reporting is done and allows retrieval of large historical datasets stored in Iceberg.
- Grafana: A dashboard and alerting system has been proposed to display relevant data in real-time and data obtained by analyzing historical data.
Log Collection Layer (Grafana Loki + Kafka)
Grafana Loki is a tool for aggregating logs from many applications and infrastructures, including servers, containers, security, and container services.
Data Flow
- Loki Agents: Each infrastructure node runs a Loki agent that captures application and system logs in real time.
- Log Structure: Logs are formatted in a universal style, such as JSON or key-value pairs, including fields like timestamp, priority, and service name.
- Publish to Kafka: Collected logs are sent to Kafka, where Loki writes them as events to specific topics based on predefined categories like error or performance logs.
Real-Time Data Streaming and Processing (Apache Flink)
Apache Kafka is a distributed messaging system that intermediates between log generation and processing. Kafka ensures durability, fault tolerance, and high throughput for real-time logs.
Data Flow
- Kafka Topics: Similarly, the Loki server aggregates collection logs stored in Kafka topics. For example, there could be topics for:
- Application logs
- Infrastructure logs
- Performance metrics
- Error logs
- Kafka Consumers (Apache Flink): Apache Flink, a real-time stream processing engine, can be configured to start consuming logs from Kafka topics in real-time.
Apache Flink Processing
- Data Ingestion: Flink consumes real-time data from Kafka, ensuring low-latency ingestion.
- Data Transformation: Flink cleans and enriches logs with additional metadata:
- Filtering: Removing irrelevant logs (e.g., debug logs during non-debug mode).
- Cleaning: Standardizing the format and removing unnecessary information.
- Enrichment: Adding metadata (e.g., error severity, timestamps, log categories).
- Real-Time Analytics: Flink carries out extensive real-time processing activities, which include aggregation, normalization, and classification of data.
- Pushing to Apache Pinot: Once processing is done, Flink pushes the cleaned and transformed log data to Apache Pinot to load further.
Real-Time Analytics and Alerting (Apache Pinot + Grafana Dashboards)
Apache Pinot stores real-time, high-throughput log data and serves low-latency queries.
Data Flow
- Data Ingestion: Apache Pinot ingests and processes logs from Apache Flink in tables optimized for high ingestion rates and fast OLAP queries.
- Schema Design: Each log type (e.g., error, performance) has a dedicated schema in Pinot for instant querying and efficient indexing.
Grafana Dashboards
- Pinot integration: Grafana integrates with Pinot as a source for real-time visualization.
- Real-Time Monitoring: Dashboards are created to track relevant KPIs of
- Application Error Rates: Real-time charting of error frequencies and severities.
- Infrastructure Performance: Real-time monitoring of CPU usage, memory usage, disk usage, etc.
- Service Latency: Latency for key services tracked in real-time; identifies bottlenecks.
- Alerting: Grafana alerting is set up threshold-based, and alerting is delivered.
- Alert Triggers: When real-time critical problems manifest, alerts trigger notifications over various channels, such as Slack, email, and PagerDuty.
Historical Data Collection and Processing (Apache Spark + Iceberg)
Real-time surveillance helps one identify a problem in preparation for the next step, but trend analysis would depend on historical data. This is where Apache Spark and Apache Iceberg help, though.
Data Flow
- Kafka for Batch Processing: A batch consumer from Kafka is scheduled for the day at Apache Spark to process logs from previous days.
- Batch Processing: Spark processes historical logs by: (1) Aggregation: Transforming the logs into usable totals (for instance, total errors for a day, average rate of performance).
(2) Transformation: Rotating the logs, formatting them, and preparing them for storage in long-term storage media. The last one is the schema to be used. - Writing to Apache Iceberg: Spark writes the transformed logs into Apache Iceberg at this stage.
Apache Iceberg
- Historical log data lake: Iceberg is used for a large volume of historical data. The iceberg is transactional and ACID compliant in the data lake setup, making it good for managing large datasets.
- Date-partitioned, daily or hourly, by the Iceberg data to enable efficient querying and retrieval.
- Schema Evolution Iceberg supports schema evolution, meaning that changes to the structure of the log, such as adding new columns, do not have the effect of altering old data.
Historical Data Querying and Analytics (Dremio + Grafana)
We rely on Dremio as our data layer for historical analysis, which offers fast querying and aggregation over Apache Iceberg-stored historical data.
Data Flow
- Dremio with Iceberg: Dremio is connected to Iceberg, which offers fast, interactive queries over large datasets.
- Reflections: Dremio also generates data reflections, which are precomputed optimized versions of queries that enable fast dashboard rendering.
- Optimization of Data Access: Dremio handles large data using columnar data access, distributed query, and query acceleration.
Historical Analytics in Grafana
- Dashboards for Historical Trends: Grafana accepts Dremio as a data source for querying historical log data and visualizing the data in Grafana dashboards.
- Monthly System Performance: An aggregated report that shows Monthly is an excellent period for trend performance monitoring.
- Error Trends: Charts that present error rates and types over weeks/months.
- Resource Usage Reports: Historical CPU, Memory, and disk usage over time to identify underutilized or overloaded resources.
- Custom Reports: Users can create custom reports based on date ranges, types of logs, and filters.
Alerting System: Both real-time and historical monitoring are tied to an alerting system within Grafana:
- Threshold-based Alerts: Designed for valuable performance indicators, like the number of errors or the usage of resources.
- Critical Alerts: Trigger alerts are sent when a limit has been crossed.
- Alert Channels: All notifications are set to multiple channels depending on the safety level required to reach DevOps or support staff, including Slack, PagerDuty, or email.
Benefits of this Architecture
- Real-time Observability: In real-time, problems occur in the application and infrastructure with Grafana and Apache Pinot.
- Alerting & Proactive Response: Alerts go out in real-time to fix problems sooner rather than later.
- Scalable Historical Analysis: Apache Spark, Iceberg, and Dremio handle huge historical datasets via scalable storage and fast querying.
- Seamless integration: Grafana offers a real-time overview from the engineering perspective as well as for historical reporting, making it easy to use for operators.
Apache Pinot offers an innovative approach to real-time monitoring and analysis of streaming data, enhancing efficiency and flexibility. Its ability to handle large volumes of data and provide instant query results makes it essential for identifying infrastructure and application issues in complex IT environments. By integrating Pinot, organizations can quickly assess system performance, proactively address problems, and reduce downtime, all while maintaining service quality.


