What is Predictive maintenance?
Predictive maintenance is a process to address potential issues before leading to breakdowns in operations, processes, services, or systems with AI in the Manufacturing Industry. It uses volumes of data collected from IoT sensors embedded in machine equipment, procedures, environment, etc. Having strong Predictive Maintenance Tools in place can prevent potential interruptions in services. It enables businesses to anticipate when and where potential breakdowns in service can occur and move to respond to them.
Why Is Predictive Maintenance Important?
Implementing predictive maintenance enables organizations to maintain critical assets for as long as possible and ensure that systems remain operational. Companies can stay one step ahead of potential breakdowns by using their data.
What are the Benefits of Predictive Maintenance?
There are several benefits of Predictive Maintenance, some of which are listed below:
- Lower the costs by reducing unplanned downtime and redundant inspections.
- Increased productivity and decreased labor and materials costs.
- Improve equipment performance and life and thus reduce the equipment lifecycle costs.
- Improve quality and reduce rework.
End Customer Perspective
Numerous questions come to the customer’s mind when the system predicts that the particular equipment will have failed and needs to be replaced. Because the replacement of components or maintenance costs too much. Customers want full confidence before returning them. If a customer answers their queries, it can build a customer’s trust and confidence. Explainable AI can answer these questions and can improve customer satisfaction.
Explainable AI helps answer all the customer’s problems and offers a transparent and interpretable system. There is a list of some of those questions and methods that can be used to answer those questions. These are given in the following table:
| Questions of Stakeholder | Methodology to be used | Implementation Process |
|---|---|---|
| Is it possible to enhance model explainability without damaging model performance? | Model accuracy vs. Model Explainability | Python and Visualization |
| What is the Influence of features on model output? | SHAP(Shapley Additive explanations) | Using SHAP library |
| How model output varies by changing the value of the particular feature? | PDP (Partial Dependence Plot) /ICE(Individual Conditional Expectation) | PDP box |
| Why did the system say that ‘component 4’ of ‘machine id 1’ will fail? | LIME | LIME library |
| What is the vibration feature threshold of knowing that the machine is working correctly and does not need maintenance? And how much system is accurate to know that threshold? | Anchors | Anchors from Alibi |
| What is the general rule that the system follows to make decisions? | defragTrees(For random forest) | defragTree Package |
Explainable AI in Predictive Maintenance
As already discussed, the machine’s maintenance cost is very high; therefore, customers want assurance of the prediction with Explainable AI in Predictive Maintenance. Several questions come to mind. Explainable AI answers all those questions and gains the customer’s confidence in the system.
Q1: Which feature influences machine failure?
The contribution of features in making decisions can help the customer trust the model. If the correct parameters influence the results, it means the model works correctly. Figure 1.4 depicts the importance of the features in predicting the output. Features are sorted by decreasing the importance from top to bottom to generate the output.
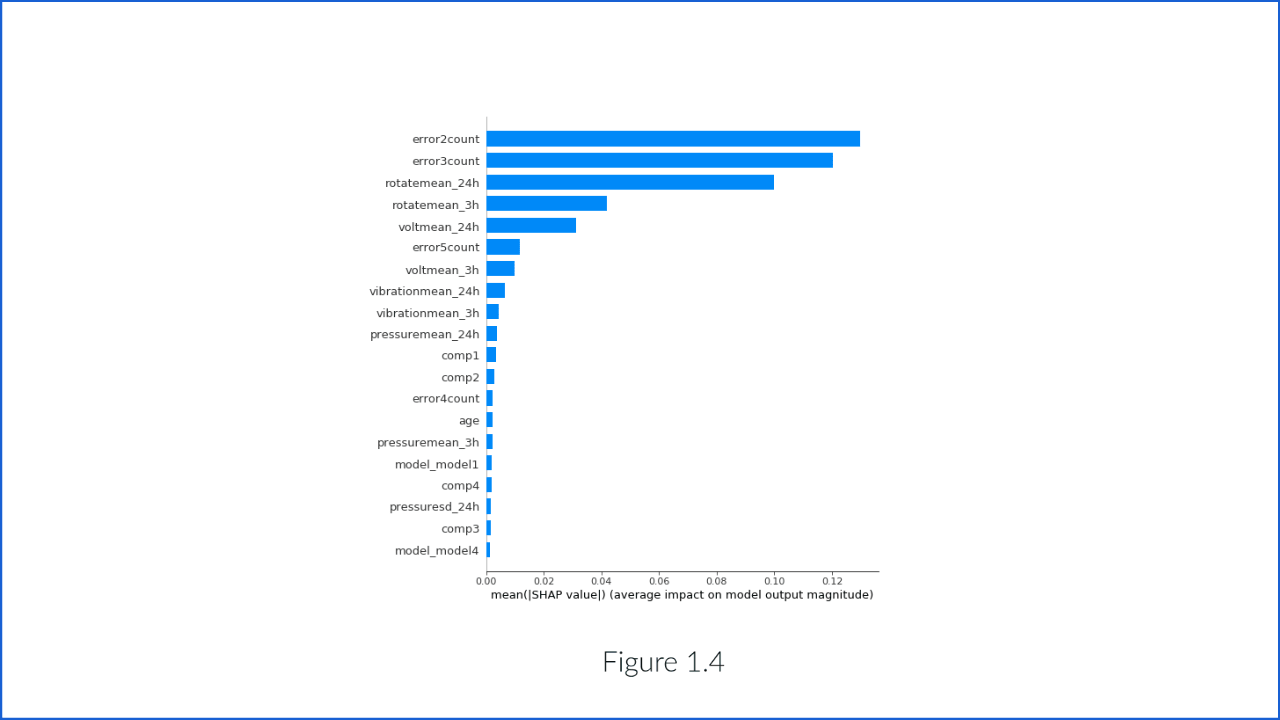
The figure depicts the probability of machine failure highly dependent on the number of times the type of ‘error3’ is encountered in a particular interval.
Q2: How is data contributing to making a decision?
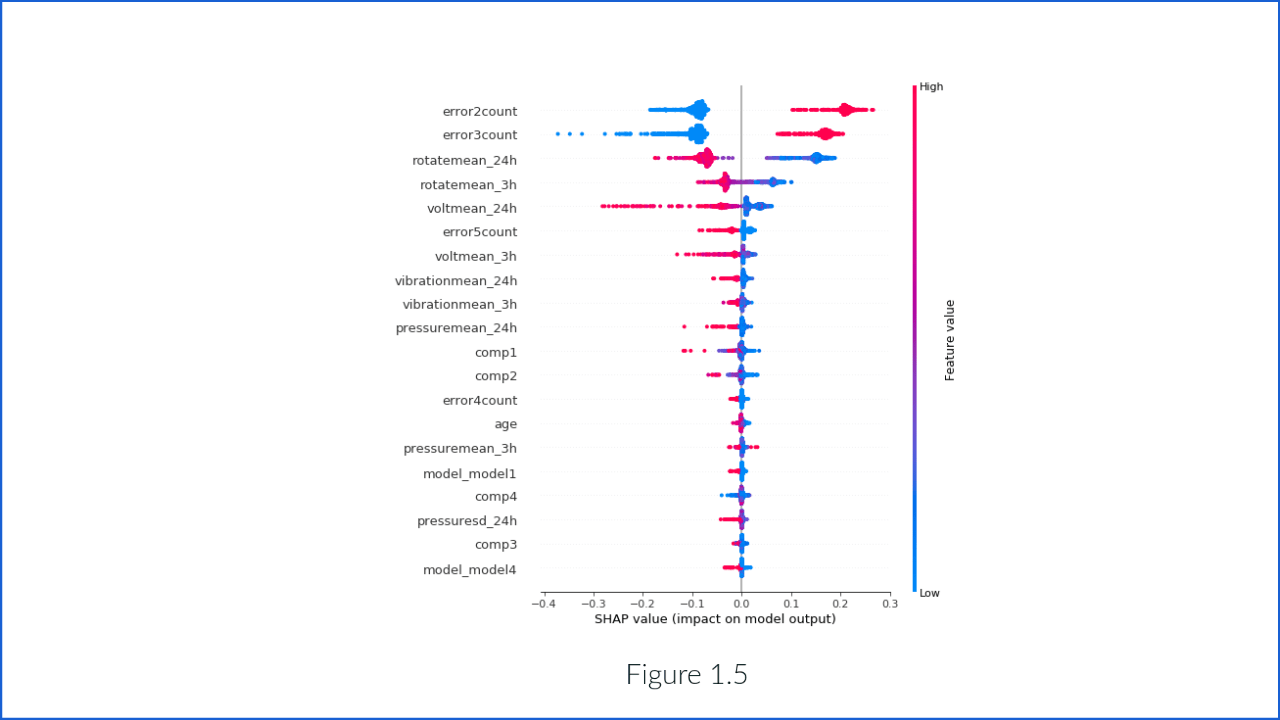
This is the next version of the previous graph. It also shows the same things with more information about its value.
- Feature importance: Variables ranked in descending order of importance.
- Impact: The horizontal location shows whether the effect of that value is associated with a higher or lower prediction.
- Value: Color shows whether that variable is high or low for that observation. Red color devotes the high value and blue to less value. The variation in color of the dot shows the value of the feature.
- Correlation: The first parameter of Figure 1.5 depicts that the error causes high maintenance probability.
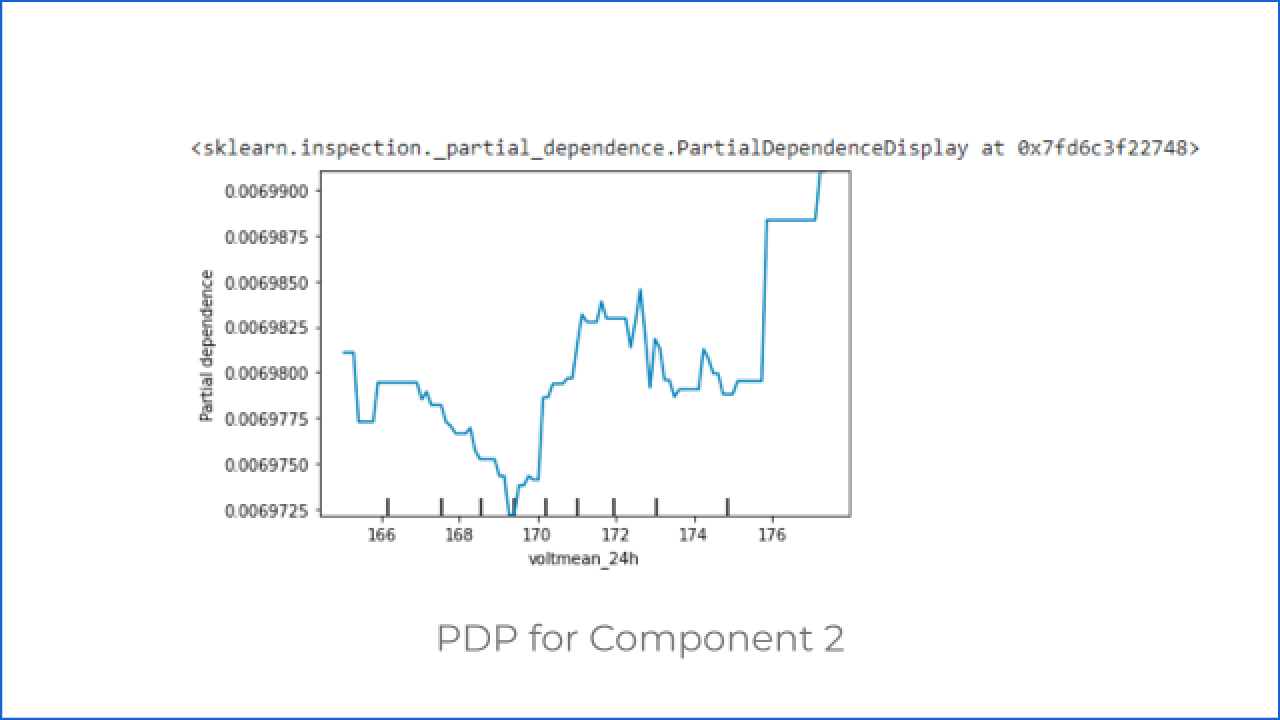
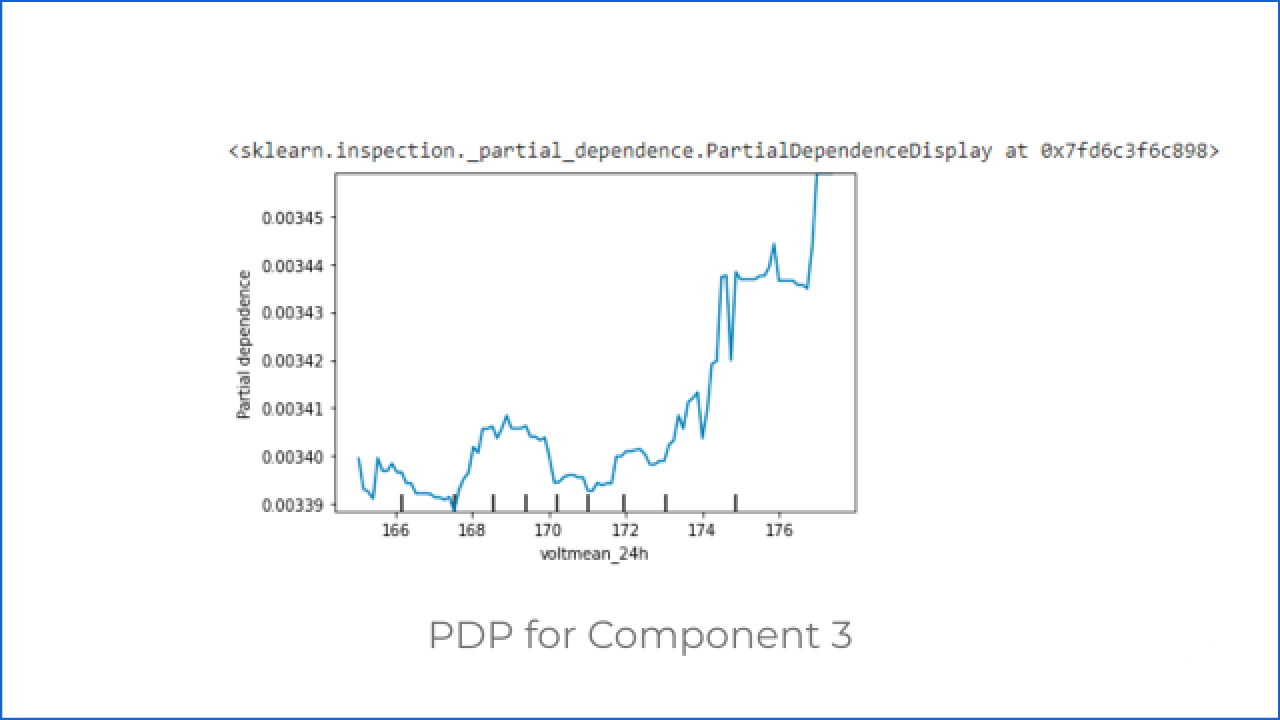
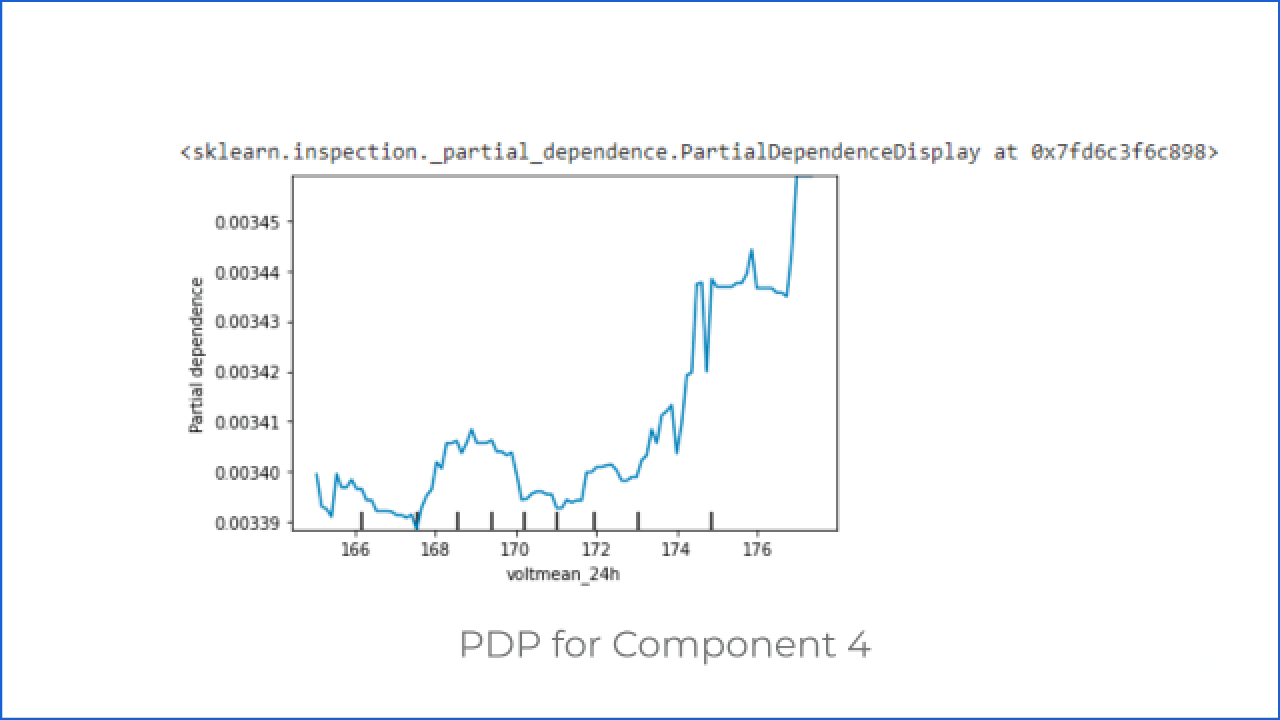
Q3: How do changes in the value of the voltage of the machine affect the system output?
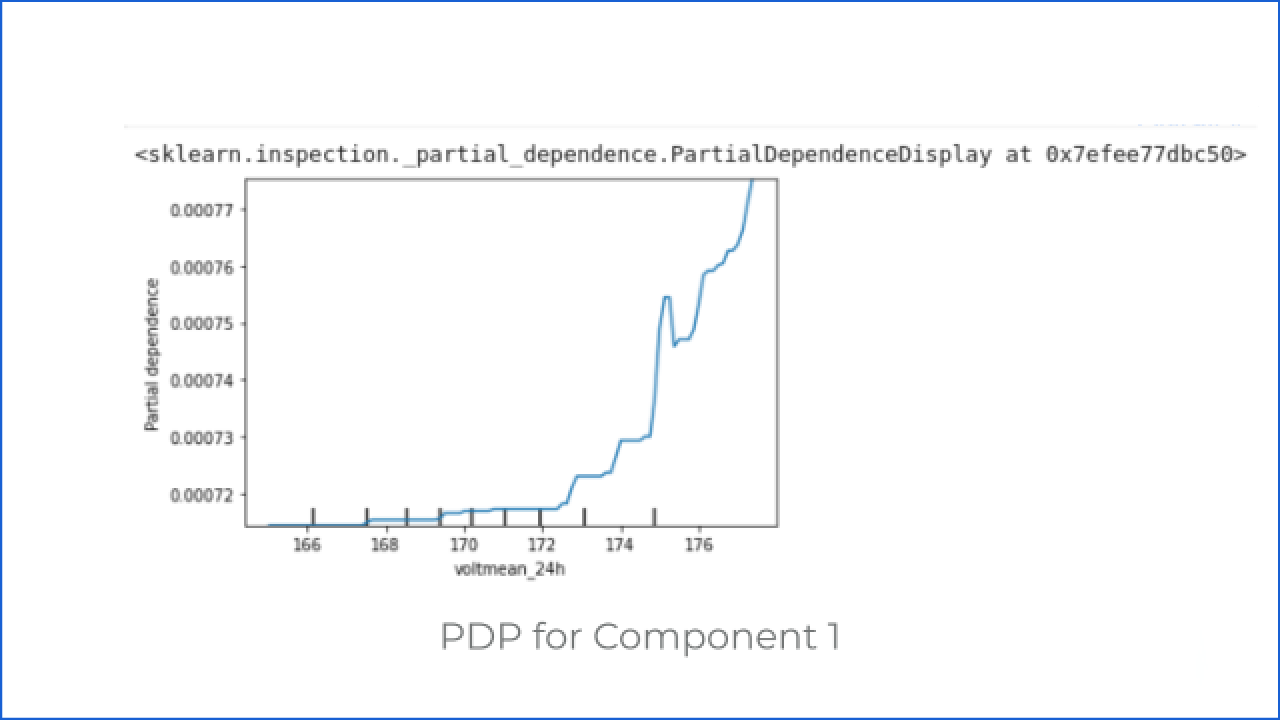
After getting the answer to the first question, the customer can ask how the change in the value of the machine’s voltage and vibration affects the system output when other parameters are not changing.
To answer this, let’s discuss the Partial Dependence Plot (PDP)
PDP shows the relation between the target response and the feature. Other features are marginalized. This particular AI system predicts the components that require maintenance in a machine. There are four components, so here we are using categorical models. Thus we can see how the voltage value change affects the probability of failure in a particular component category.
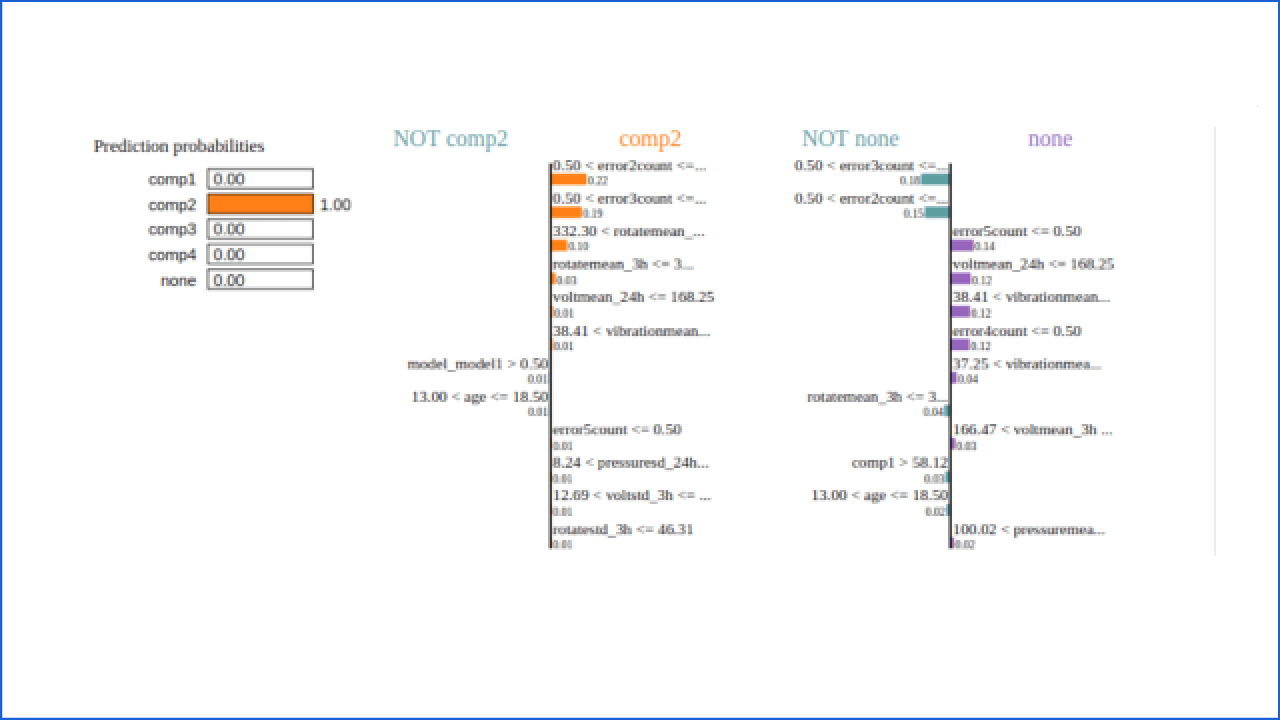
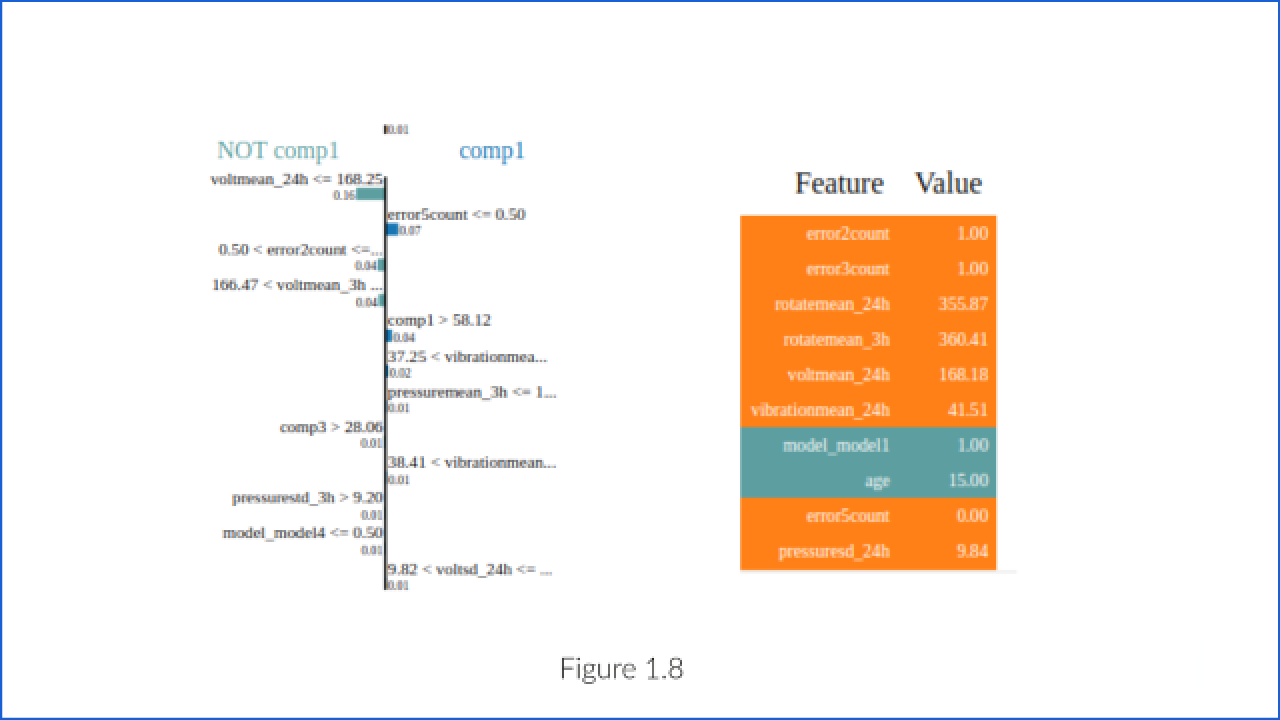
Q4: Why did the system say that ‘component 2’ of ‘machine id 1’ will fail?
Customers will ask for justification when the system predicts that a component will fail. Because if the system indicates wrong and gives false results for maintenance of the machine component, it doesn’t need any maintenance to waste a lot of money and resources.
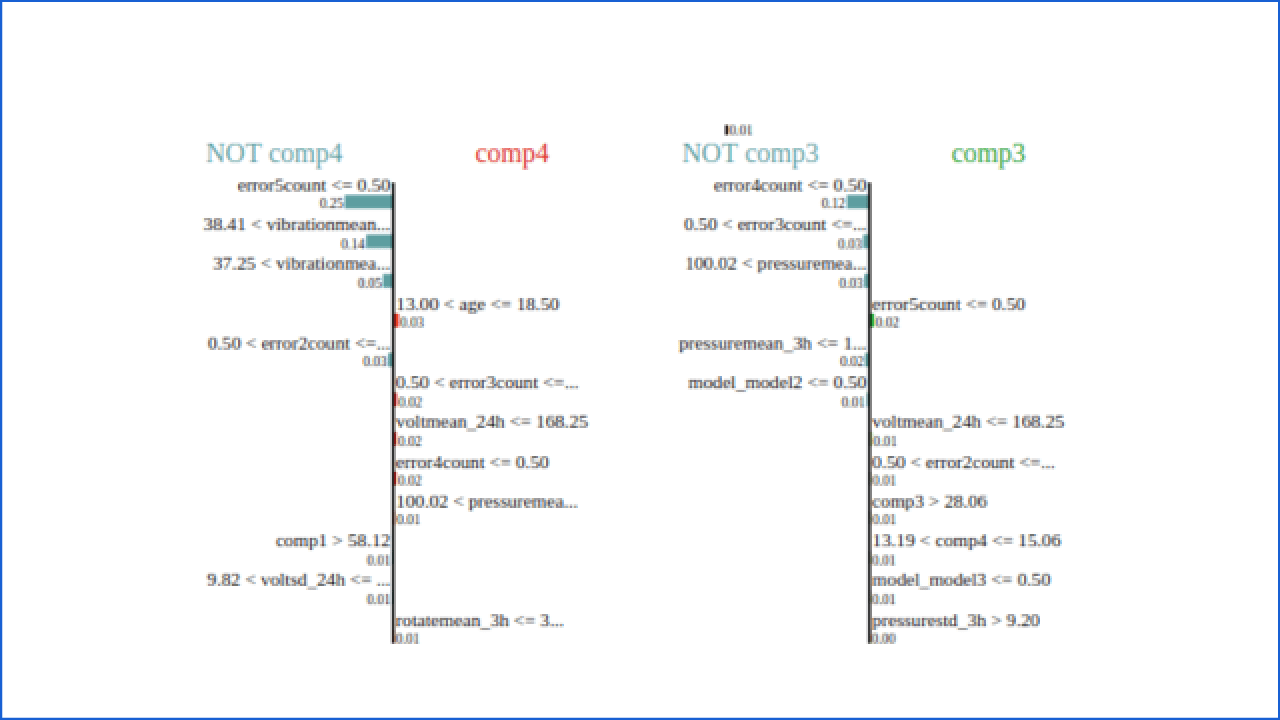
Using LIME system plots and justify its result.
It displays explanations for individual predictions, so they expect a single row of an Explanation object as input. Using LIme Figure 1.8, justify why the system decided that comp2 would fail.
Conclusion
Delays in production due to mechanical problems have high costs. Most of these businesses predict these problems with Explainable AI in Predictive Maintenance to prevent the problems before they occur actively, which will reduce the costly impact caused by downtime. But that system should be accurate and transparent so that users can track its performance.
Explainable AI is an approach to gaining customers’ trust and confidence. It makes the system more trustable and interpretable. With this approach, we can make our system more productive by tracking performance, fairness, errors, and data.


